srisara said:
Amit,
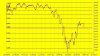
I am attaching the Daily Chart of NIFTY. I could identify the TRIX Bearish Divergence.
What do you feel about it?
Satya
Hi Satya, this Trix divergence in the Nifty has been present since the Dec 14.
It was also present around Dec 7 or 8 when Karthik had first posted it and then it abruptly turned positive.
At best it's indicative of a temporary slowdown, and I'm saying slowdown rather than weakness, and not even remotely considering the use of 'reversal'.
Since the time Karthik pointed to it then, the Nifty has come up a fair distance, and even now is set to go up further.
I have found indicators like RSI and Trix and a few other popular ones to be rather fuzzy when it comes to indexes mainly, and often enough when it comes to stocks too.
The Nifty is a basket of fifty stocks, and more often than not there will always be a counterpoint present at any given time. Today it's the Reliance pack draging it down and next it's the capital goods majors pulling it up. Now the a/d ratio has gone way negative, and then it the international Oil prices dipping. Now it's the domestic funds buying in heavily in the banks and next the FIIs are booking profits in the FMCG counters. Some are building major short positions now and running to cover them next. Now there is this German fund coming in with huge masses of money, now it the Japanese. All of this any much much more is acting upon the movement of the index. So the indicators become rather nebulous quite often as illustrators of reversals, often in the short run too.
If you looked at the long term charts of the Nifty, whether daily or weekly or monthly, the trend is most positively to the up.
In the midst of a strong bull run, or even a bear trend, there will be periods of reflex contrary moves, corrections, consolidations etc., and pouncing on any particular indicator showing divergent signals is going to mislead. A strong trend in either direction is always considered as intact till conclusively broken.
While price action is the major ingredient for most indicators, it's often more reliable to keep eyes peeled for certain formations like H&S or Double Top/Bottoms along with their chief associate, volume. You are less likely to go wrong here.
If your concern is in the short term, yes the Nifty has had two volatile and flat to bearish sessions and the Trix is showing this.
However all this can change abruptly at any time without warning.
This is as much as I can say for now.


 63.2 KB Views: 21
") ).
).