Some of my forecasts

Status
Not open for further replies.
Re: Bhel

RK, you are all over that one.
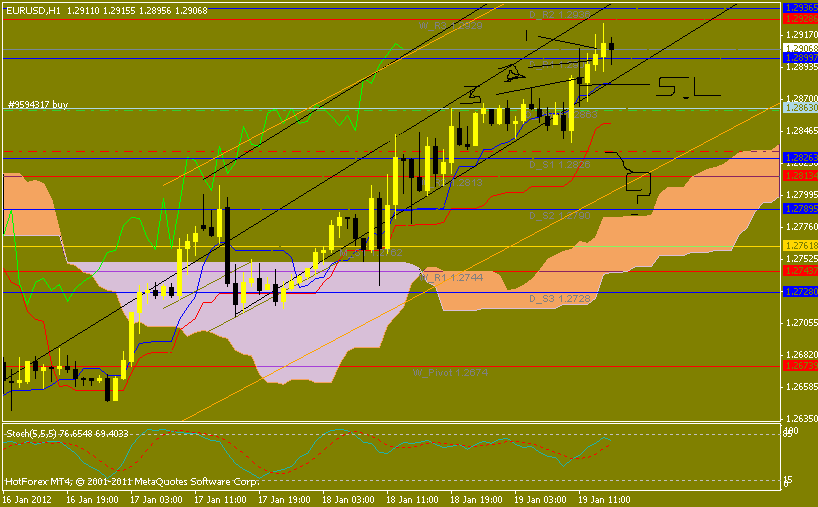

Hourly


4 Hours


Daily


Weekly


Similar set of charts as in case of LT
in daily charts price has been resisted nicely at 281-284 for 2 days even today the price has been pusshed further down to 265
Weekly is still far away from the cloud as well as trendline
in four hour chart we are correcting and may get suppored on the cloud, above that there is kinjun reading at 262 on the previous day, which may get stright in the future and provide support
Seeing that correction has already taken place we may move east or north after spending sometime, lower edge of cloud is at 247 and chances of geting inside the cloud are high eaven with sideways move
so i think we should get ready for long entry soon
Weekly kinjun is also far away around 310, Daily kinjun should support at 254


I am just making my view with very learning till now and i know i have a long way to go
kindly correct me what ever i am reading wrong in this set of charts
 

EagleOne

Well-Known Member
LOL, yes, Eagle, we are short on the quality photos such as what is posted at Nifty50.

You might say it is all business here.
Have you seen the 'disco' colors of the 'artwork' displayed in your gallery, Pips? Damn! Get me a doctor, I am having trouble focusing my eyes! :lol:
 
That's what happens when the Gap Band drops a bomb. Colors end up all over the place. (Wow! 1981.)

For you, I have the solution in the words of Nillson:
"Put the lime in the coconut drink it all up....
Then you call me in the morning. I'll tell you what to do."


Have you seen the 'disco' colors of the 'artwork' displayed in your gallery, Pips? Get me a doctor, I am having trouble focusing my eyes! :lol:
 
Nothing like a live example, so here we go. BTW, never mind the pitchforks on here. Kavima got inside my head, so I'm experimenting.

Notice where my stop is on the current trade on this pair. Look at the current candle, count 3 back, take your crosshair, and it lines up perfectly with the kijun level 3 candles back.

Even though my stop is being trailed with the hourly, I still don't see here all day and tick watch. When I go somewhere, then come back to my computer, I just update the trail. When the market slows down around 10:30 your time, I'll take the microscope and trail it with the 15-min. By then, I'm guaranteed profit.


image host
Sir if I look at the current candle on the chart above and count 3 back the stop should be above the tenken sen and also above the buy price lol I am having a hard time understanding this :/ sir by counting 3 candles back how the stop came below the kinjun I still can't get
 
Eur/usd

Let's see. I think I'll get back to forecasting.

What happened to the downtrend? MT, it is still headed lower.
For now, this pair put the weekly tenken at 1.3089 on its radar. After ward, the UP could continue to 1.3201. Once the pair arrives there, it could be a return to the trip south.

Note: I'm probably going to hold my long position for multiple days until the target has been hit. I jumped on this freight train. I don't think I want to take daily station breaks.
 
Saif, hopefully this clears it up and for anyone else who had questions that did not ask.
The arrow pointing up is pointing to the 3rd candle back. The arrow pointing to the left is pointing to the kijun as it pertains to that 3rd candle. That exact reading of the kijun is my stop.
BTW, on shorts you have to add your broker's spread.


jpeg image hosting


Sir if I look at the current candle on the chart above and count 3 back the stop should be above the tenken sen and also above the buy price lol I am having a hard time understanding this :/ sir by counting 3 candles back how the stop came below the kinjun I still can't get
 
Status
Not open for further replies.
Thread starter Similar threads Forum Replies Date
J Introductions 2
U Forex 2

Similar threads