Re: Weekly Forecast--021212
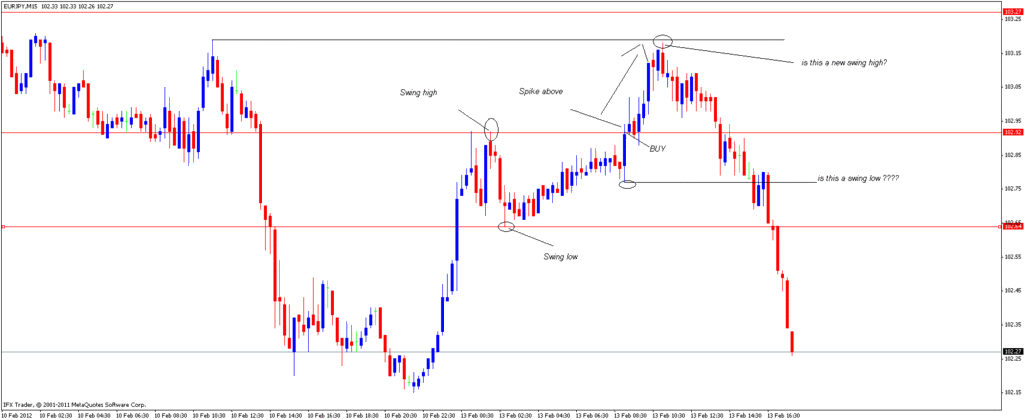
In my opinion, EUR/JPY looks very strong and can continue to 105.35 before any kind of reversal.
EUR/USD looks poised and has hit the WR1. It does not look very strong, still can reverse back down anytime. I would like to enter into this little lower or higher but not at this level.
Regards
Raj
EUR/USD: With last weeks strong reversal, it may have signaled the end of the MT correction, which means my MT forecast would be off by close to 200 pips. That is still not confirmed, but what is confirmed is that the DOWN will continue this week. It is doubtful the WR1 at 1.3277 will be hit this week, but the correction will continue north to start the week. To the south, we have the WS2 at 1.3033 to look forward to. Watch for a reaction at that point. If we get too far past it, then were going to the low-1.2900s.
EUR/JPY: The move south that ended last week will go deeper this week. It does not appear it is ready to reverse, but may have entered an extended consolidation phase. Ideal containment is 101.21, but it could go to 100.78. Anything below the latter, and then it gets ugly for future direction.
EUR/JPY: The move south that ended last week will go deeper this week. It does not appear it is ready to reverse, but may have entered an extended consolidation phase. Ideal containment is 101.21, but it could go to 100.78. Anything below the latter, and then it gets ugly for future direction.
EUR/USD looks poised and has hit the WR1. It does not look very strong, still can reverse back down anytime. I would like to enter into this little lower or higher but not at this level.
Regards
Raj