


Some of my forecasts
- Thread starter 4xpipcounter
- Start date
- Status
- Not open for further replies.

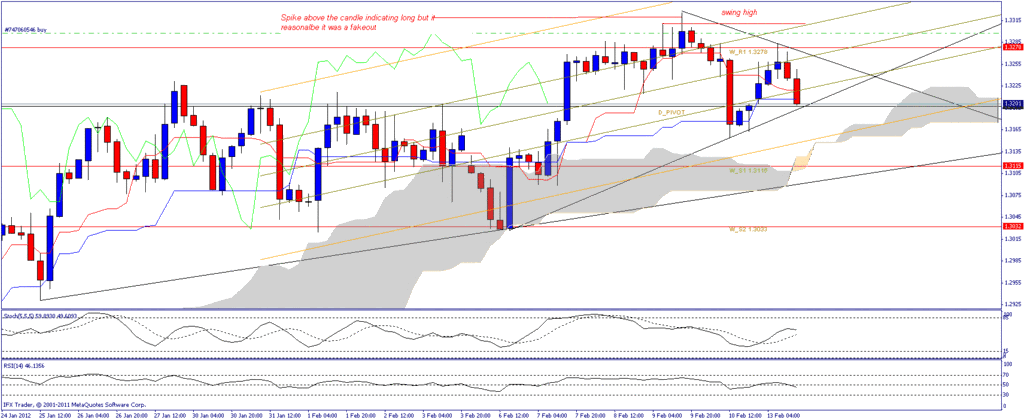
No No sir I had No intention to nail it LOL that was actually a question you can the first oval shaped swing high marked when there is a spike above that swing high we enter long there and ride it where it creates a new swing high sir you can see on the eastern hand side there are two oval top and bottom marked one is the new swing high right and the bottom is the new swing low?so which was is the right swing low the first bottom of the left hand side of the chart or the second bottom on the right hand side of the chart or would it be both ??
Perfect, Pirate! You nailed it!
Last edited:
Re: IFCI
LOL, I wasn't satisfied with your chart, so I had to mark it up--lol.
You're looking through the eyes of what we learned concerning the ichimoku, and I'll address that directly, but for the benefit of others, I want to address what we have learned to this point on Price action. Actually, it will answer how to get in on the action, and I'll even show you a trick I employed on a EUR/JPY position I had last week.
On the way north, notice the swing high horizontal lines that I drew, and then the subsequent price action. That's how you get in on the action.
Notice the slight pullback when you got near the 2nd swing high, plus already perched over the cloud. That could have been a good place to jump out. Yet, at that point, you had no idea (especially with the condition of your RSI) that it would continue to rise like it did. At that point (This is what I did on the EUR/JPY last week.), Set and entry a few points beyond the 2nd swing high, with double the position. Now, it is like having the original still up, and a new one.
Now, let's get back to the ichimoku. There is one thing that is very clear. The altimeter indicates that on the daily you are in ear-popping territory. The weekly is showing we are approaching a fresh cloud at the bottom. As far as the 3rd swing high line is concerned, forget it! It is not getting hit, at least on this leg. So, for the reversal, look to the west on the daily and see where the cloud leveled. That could be strong R. Then next R would be the bottom of the weekly.
For the correction, there is a strong cluster event on the weekly where there TK is meeting at, and it matches nicely with the cloud to the east. As long as it holds, then the top of the daily should also hold, and then you have the makings of another leg north.
Here i want to know how to catch big rally from marked in weekly chart using ichimoku
* Chikou was above candles @ around 24
* It was in OS zone
* Anything else we can look @ ?
Now where it is going ?
To touch bottom of cloud in weekly?
Already in OB zone

free image hosting
* Chikou was above candles @ around 24
* It was in OS zone
* Anything else we can look @ ?
Now where it is going ?
To touch bottom of cloud in weekly?
Already in OB zone
free image hosting
Re: IFCI
LOL, I wasn't satisfied with your chart, so I had to mark it up--lol.
You're looking through the eyes of what we learned concerning the ichimoku, and I'll address that directly, but for the benefit of others, I want to address what we have learned to this point on Price action. Actually, it will answer how to get in on the action, and I'll even show you a trick I employed on a EUR/JPY position I had last week.
On the way north, notice the swing high horizontal lines that I drew, and then the subsequent price action. That's how you get in on the action.
Notice the slight pullback when you got near the 2nd swing high, plus already perched over the cloud. That could have been a good place to jump out. Yet, at that point, you had no idea (especially with the condition of your RSI) that it would continue to rise like it did. At that point (This is what I did on the EUR/JPY last week.), Set and entry a few points beyond the 2nd swing high, with double the position. Now, it is like having the original still up, and a new one.
Now, let's get back to the ichimoku. There is one thing that is very clear. The altimeter indicates that on the daily you are in ear-popping territory. The weekly is showing we are approaching a fresh cloud at the bottom. As far as the 3rd swing high line is concerned, forget it! It is not getting hit, at least on this leg. So, for the reversal, look to the west on the daily and see where the cloud leveled. That could be strong R. Then next R would be the bottom of the weekly.
For the correction, there is a strong cluster event on the weekly where there TK is meeting at, and it matches nicely with the cloud to the east. As long as it holds, then the top of the daily should also hold, and then you have the makings of another leg north.
But how to decide whether we should enter when it is already in OB zone.
Sometime swing high also work as a double top. What we should do in this condition ?
You're looking through the eyes of what we learned concerning the ichimoku, and I'll address that directly, but for the benefit of others, I want to address what we have learned to this point on Price action. Actually, it will answer how to get in on the action, and I'll even show you a trick I employed on a EUR/JPY position I had last week.
On the way north, notice the swing high horizontal lines that I drew, and then the subsequent price action. That's how you get in on the action.
Notice the slight pullback when you got near the 2nd swing high, plus already perched over the cloud. That could have been a good place to jump out. Yet, at that point, you had no idea (especially with the condition of your RSI) that it would continue to rise like it did. At that point (This is what I did on the EUR/JPY last week.), Set and entry a few points beyond the 2nd swing high, with double the position. Now, it is like having the original still up, and a new one.
Now, let's get back to the ichimoku. There is one thing that is very clear. The altimeter indicates that on the daily you are in ear-popping territory. The weekly is showing we are approaching a fresh cloud at the bottom. As far as the 3rd swing high line is concerned, forget it! It is not getting hit, at least on this leg. So, for the reversal, look to the west on the daily and see where the cloud leveled. That could be strong R. Then next R would be the bottom of the weekly.
For the correction, there is a strong cluster event on the weekly where there TK is meeting at, and it matches nicely with the cloud to the east. As long as it holds, then the top of the daily should also hold, and then you have the makings of another leg north.
Here i want to know how to catch big rally from marked in weekly chart using ichimoku
* Chikou was above candles @ around 24
* It was in OS zone
* Anything else we can look @ ?
Now where it is going ?
To touch bottom of cloud in weekly?
Already in OB zone
free image hosting
* Chikou was above candles @ around 24
* It was in OS zone
* Anything else we can look @ ?
Now where it is going ?
To touch bottom of cloud in weekly?
Already in OB zone
free image hosting
Sometime swing high also work as a double top. What we should do in this condition ?
Pirate, you nailed all the swing highs and lows right.
I'll get into TP's and stops later.
I'll get into TP's and stops later.
No No sir I had No intention to nail it LOL that was actually a question you can the first oval shaped swing high marked when there is a spike above that swing high we enter long there and ride it where it creates a new swing high sir you can see on the eastern hand side there are two oval top and bottom marked one is the new swing high right and the bottom is the new swing low?so which was is the right swing low the first bottom of the left hand side of the chart or the second bottom on the right hand side of the chart or would it be both ??
Here's a pic of my latest trade. I'm only doing this to show the effectiveness of what I'm talking about.
I took the short out on the 15-min break. The hourly hit, so I'm back in (I'm -5 pips. Should I panic--lol?). The black line would be broken next, so I'll probably add on there (Don't forget, according to my Weekly Forecast, this market should hit 1.3033 this week.)
BTW, I'm not knocking demos and the ones showing gains on their demos. This is my live hedge fund I'm trading, so I'm putting my money where my mouth is.
Also, I am putting lots of emphasis on price action lately, but that is because of the series I've started. It is not in exception to my core methodology, but in lieu of it.

jpg image hosting
I took the short out on the 15-min break. The hourly hit, so I'm back in (I'm -5 pips. Should I panic--lol?). The black line would be broken next, so I'll probably add on there (Don't forget, according to my Weekly Forecast, this market should hit 1.3033 this week.)
BTW, I'm not knocking demos and the ones showing gains on their demos. This is my live hedge fund I'm trading, so I'm putting my money where my mouth is.
Also, I am putting lots of emphasis on price action lately, but that is because of the series I've started. It is not in exception to my core methodology, but in lieu of it.
jpg image hosting
Re: Hindustan Unilever
The weekly is suggesting there is room to fall, but that doesn't mean it will.
The daily is what caught my attention.
We had the downtrend, and then the market has traveled east since then. The downtrend is a fresh break from the UP.
Price has gotten comfortable under the cloud as projected to the east, which suggests a cloud break.
Unless some unseen volatility stirs the pot, the break from the cloud will be south.
In daily it is struggling to get out on either side, It did not breaked previous low.
I want to know where this is market is headed.

jpg image hosting
Weekly

I want to know where this is market is headed.
jpg image hosting
Weekly

Remember the metaphor on the mountains. I try to give those metaphors, so they stand out in your mind, as to the importance of identification.
I put the peak of the mountain in the oval. The peak is the swing high for that TF.
If you scope down to the 5-min or 15-min, you may have actually notice a long opportunity relative to that move.
Just because something makes a new peak, it does not qualify it as a swing high.
I put the peak of the mountain in the oval. The peak is the swing high for that TF.
If you scope down to the 5-min or 15-min, you may have actually notice a long opportunity relative to that move.
Just because something makes a new peak, it does not qualify it as a swing high.
Sir only related to the price action if I am not wrong this swing high was a head fake on the h4 there was a spike above it and then it reversed back down ?

image hosting gif
image hosting gif
- Status
- Not open for further replies.
| Thread starter | Similar threads | Forum | Replies | Date |
|---|---|---|---|---|
| J | Global Market Astro's innovative and accurate forecasts | Introductions | 2 | |
| U | Daily Forex Forecasts (D'Ani Foresight) | Forex | 2 |
Similar threads
-
Global Market Astro's innovative and accurate forecasts
- Started by johnrolan19
- Replies: 2
-