Thomas DeMark Sequential System

anilnegi

Well-Known Member
ST

thanks for nice thread but if one have to start afresh, how to start countdown, is it from PL also pls confirm which TF is best for trading this stragegy, thanks

anil
 

MurAtt

Well-Known Member
Just started this thread - pg 2 - and it hit me bang !!!!

Grey Markets or non-technical - If any stock/index makes a high (swing) and that high is not broken in the next 18 sessions !!! Bye Bye .. we have a reversal/correction coming ...

This is esp true for Nifty .. i.e. "at 5100 was infomred of this by a friend ... if in the next 18 session (daily) price does not cross 5100 again .. bye bye Nifty"

Almost on the same lines ... :)
 

MurAtt

Well-Known Member
ST bhai

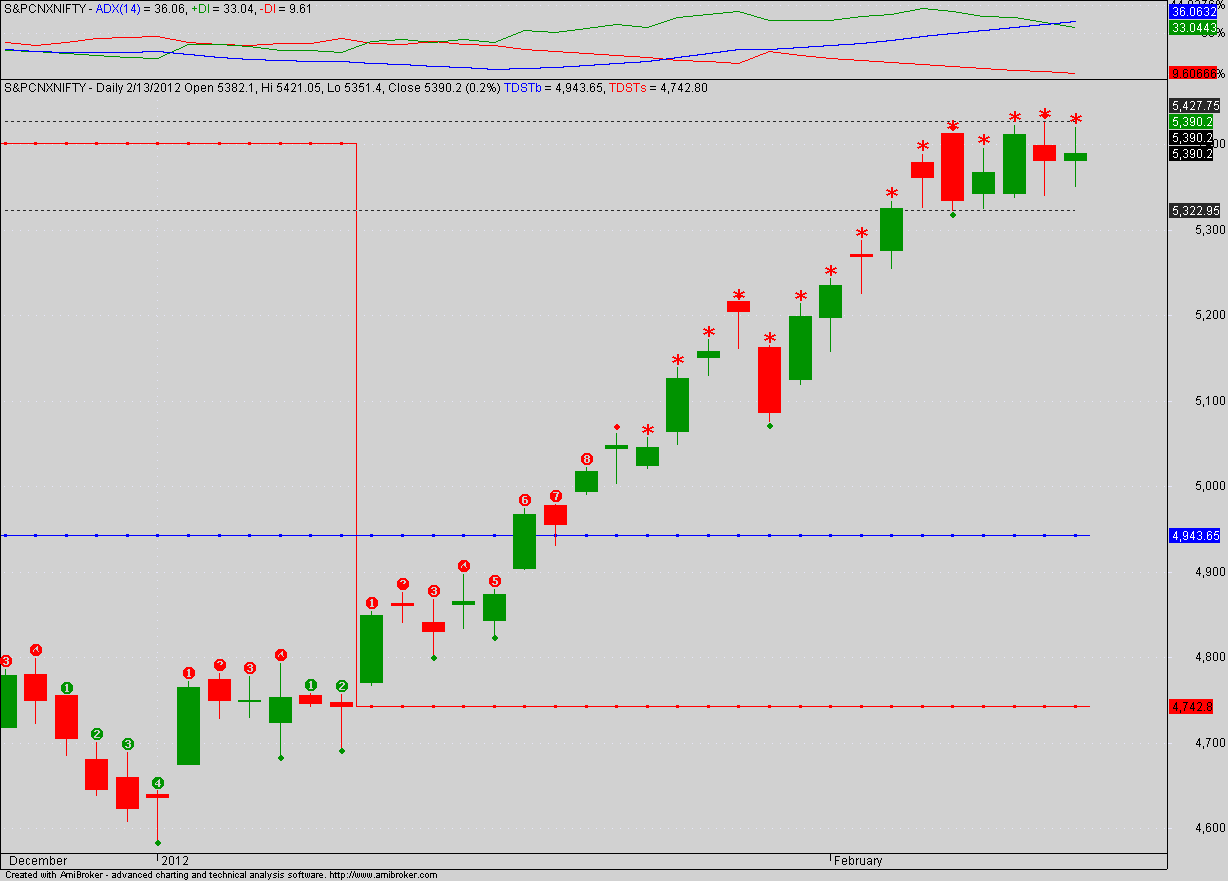
I am a bit confused with this one. I am attaching Nifty Spot chart with the AFL u hv given.
It show bars 1-8 BUT not nine and then all bars are mostly marked with a '*'.

Can u elaborate with this chart as example - as it will serve 2 purpuses.
1. Understand on my chart would be easier for me
2. Current setup which u have said is active for top can also be simultaneously followed and discussed.
OR
U post another chart with markings and redescribe please.
Pic-Tex corelation would be much easier to understand.

Thanks.

Murtaza
Murtazabhai,

Go to parameters of that AFL and disable the first 2 options and just keep "show TDST lines option" , this will avoid clutter in the chart. You will get red lines and blue lines once set ups are completed.The moment you get a red line means the sell set up of min 9 bars is completed.

After 9 set up bars, look for intersection in case of stocks and commodities. After that start counting countdown days.The AFL does not count the countdown days correctly. Use it for set ups and TDST lines only.

Smart_trade


I am posting Nifty Futures Sequential counts marked on the chart. Here I have ignored Intersection phase as it is not required for indices. But it is advisable to keep an eye on Combo and Sequential by considering intersection. If we consider intersection then we have completed 8 count down bars so far.

But as indices and combo do not need intersection and also that combo is also giving topping out indication , I am considering sequential without intersection.

The 1 and 9 marked in black are set up bars....and 1 to 13 marked in red are countdown bars. My chart is of Nifty futures....in Nifty cash there wont be much difference .

Smart_trade
 

Blitzz

Well-Known Member


I am posting Nifty Futures Sequential counts marked on the chart. Here I have ignored Intersection phase as it is not required for indices. But it is advisable to keep an eye on Combo and Sequential by considering intersection. If we consider intersection then we have completed 8 count down bars so far.

But as indices and combo do not need intersection and also that combo is also giving topping out indication , I am considering sequential without intersection.

The 1 and 9 marked in black are set up bars....and 1 to 13 marked in red are countdown bars. My chart is of Nifty futures....in Nifty cash there wont be much difference .

Smart_trade
Hello Mr. Smart Trade

Can you please indicate the levels at which the Sell will be triggered.And bit more on the scenarios where the count will get refreshed.
 
Hello Mr. Smart Trade

Can you please indicate the levels at which the Sell will be triggered.And bit more on the scenarios where the count will get refreshed.
We are in sell mode as per combo which completed its 13 th bar on the bar where 12 is marked on the above chart. sequential completed countdown today ie on the llast bar in the chart......I am going with combo and initiating short positions in the upmoves/rallies....the stoploss is 5600 on closing basis....about 150 points away...so small short positions are initiated as the market rallies up and we go closer to the stoploss.

This is a trend reversal anticipation method and we are taking contra positions against strong trend so small positions and that too in rallies.

Smart_trade
Thanks ST for guiding us on using this great system
 

Similar threads