Trading With Chart Pattern

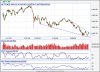
hai Senior guys, need some comment on dis 60 min Intra day Chart Of HCL. How can one trade this now, jus see the bar formation between the two vertical lines. Can u share your wisdom n help me, on the probability of dis trade on buy side, or even if its qualify as a trade???? Also take note of the zig-zag moves between the two vertical lines, lot of hooosh-woooosh, sumthing fishy.

Feel free. thanks........

M attaching d chart.
I think the daily chart is in the down trend.According to saint we should not even think of going long when the weekly and daily trend is down.i think it is a good opportunity to short when the pull back rally ends.we get sell signal when price breaches the previous day's low put stop at the previous day's high.But the big question is "how long will the pullback rally last" According to experts pullback rallies last for even weeks in bearmarket untill the original downtrend resumes its direction.
 
U

uasish

Guest
Souyma,

Plz activate this Thread,yesterday i wrongly interpretated a 'Falling Wedge',some educative material with charts can guide us better.

Asish

N.B. Still remember your Nifty Analysis with Pattern,prior to the Down Fall.
 
D

darsh_goswami

Guest
Sam ,..

One can consider long on a highest high of whole zigzag, by keeping SL around S2 levels. Its my view.

regards,.
Darsh
 
L

learn2trade08

Guest
Dear darsh,
yesterday you were talking of the abcd in a fibonacci...could you please provide us a link where we could learn about the ab=cd pattern...
thanks


Sam ,..

One can consider long on a highest high of whole zigzag, by keeping SL around S2 levels. Its my view.

regards,.
Darsh
 
Souyma,

Plz activate this Thread,yesterday i wrongly interpretated a 'Falling Wedge',some educative material with charts can guide us better.

Asish

N.B. Still remember your Nifty Analysis with Pattern,prior to the Down Fall.
Dear uashish
you yourself are an experieced trader,i think(more than 7000 posts).Then you might have read all the important books on TA then why do you request soumya to help you teach falling wedge :confused:.after all you are a moderator?This indeed shows ur simplicity and humble behaviour.hats off to you.
regards rr
 
Last edited:

pleaseharsh

Well-Known Member
hello...
is 158.5 a major support for rpl ?
also i am using ema 15 & ma 25 combination on charts ..is it a right combination ? means which is the best combination for charts ?

harsh
 
Last edited:
L

learn2trade08

Guest
sincerly appreciate your posting sir,definitely would be helpful if more people post their views...
Please find the attached chart...would like your views as well...
thanks

A falling wedge is seen in nifty.
 
Last edited by a moderator:

Similar threads