Trading With Chart Pattern

sincerly appreciate your posting sir,definitely would be helpful if more people post their views...
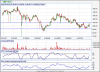
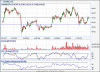
Please find the attached chart...would like your views as well...
thanks
Though it does not seem to be a head and shoulder it is similar to a ascending triangle.what ever pattern it may be it can be bought if it breaches the upper resistance line. use 60 min charts for entry and strict stop below the support line.
 
Though it does not seem to be a head and shoulder it is similar to a ascending triangle.what ever pattern it may be it can be bought if it breaches the upper resistance line. use 60 min charts for entry and strict stop below the support line.
dear friend,

although it is not a very classic inverted H&S pattern, yet we can call it one because volume is decreasing gradually as right soulder is forming. you have said that ascending triangle is forming; what i have read is ascending triangle forms in an uptrend and not in a downtrend. please clarify if i am missing something somewhere!

regards,

nick
Dear nick
i wonder how would u call that a head and shoulder :confused: (h and s without left shoulder:confused:).As far as ur view on ascending triangle, you are absolutely correct accordin to theory.Theory says that ascending triangle is an continuation pattern.But there are instances when it also becomes reversal pattern.for eg head and shoulders are theorotially reversal patterns but do u know there is one such thing as head and shoulder continuation patters? yes there is h and s continuation.(u can see them clearly illustrated on ashwini gujral's book on chartpatterns.)
see the link provided below
http://stockcharts.com/school/doku...._analysis:chart_patterns:ascending_triangle_c
The CHART PATTERNS ARE NOTHING BUT THE COMBINATION OF SUPPORTS AND RESISTANCE LINES. so no need to argue, we just need to follow the support and resistance only.:)
 
Last edited:
Dear nick
i wonder how would u call that a head and shoulder :confused: (h and s without left shoulder:confused:).As far as ur view on ascending triangle, you are absolutely correct accordin to theory.Theory says that ascending triangle is an continuation pattern.But there are instances when it also becomes reversal pattern.for eg head and shoulders are theorotially reversal patterns but do u know there is one such thing as head and shoulder continuation patters? yes there is h and s continuation.(u can see them clearly illustrated on ashwini gujral's book on chartpatterns.)
see the link provided below
http://stockcharts.com/school/doku...._analysis:chart_patterns:ascending_triangle_c
The CHART PATTERNS ARE NOTHING BUT THE COMBINATION OF SUPPORTS AND RESISTANCE LINES. so no need to argue, we just need to follow the support and resistance only.:)
dear friend,

i am not arguing. as the left S was not prominent, i said not a classic H&S pattern. you are right when you say CHART PATTERNS ARE NOTHING BUT COMBINATION OF SUPPORTS AND RESISTANCES.

we need to follow support & resistance only keeping a close eye on price.

regards,

nick
 
Hi Raja,

According to me Reliance has formed inverted H&S on daily charts. could u pls check and correct me if i am wrong

thanx
veena
yes veena u are correct.Buy when the price breaches the resistance line.look for good volume on breakout.Target is around 2700.I think head and shoulder is formed because of falling crude prices.see the attached chart.
 

Attachments

thanx very much Raja. could u pls tell me at what level i should buy and what should be the stop loss.
And one more thing pls keep on posting charts as that is a great source of knowledge for us.

thanx
veena
 

Similar threads