Trading With CrossOver And BB

Status
Not open for further replies.

SavantGarde

Well-Known Member
Re: Query about Welspun India

BonoBuddy,

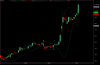
It Will Move Up Atleast 30% From Current Price....
Henceforth, Please Put Your Queries In The Mother Thread.


SavantGarde

Dear Savant Sir,

Thanks for the earlier reply.

I have a query about Welspun India. I have 1250 shares at 41.5 bought in 2008. the stock is currently at 43.4. Can I sell at this rate? Or will it move higer

Awaiting your reply

Thanks

Bono
 

asnavale

Well-Known Member
Here Is How Buy Sell Arrows Are Shown After Scanning Through Automatic Analysis Window (AFL Used Is First Among Listed In Repective Ami Thread):


Thanks.:)
Hi Doc,

I was just experimenting with your code. I used EMA instead of SMA, the periods being same. When I plotted the AFL I got the chart as shown in the attachment. You can see in the chart that, with EMA there are only three signals: 18-3-09 - Buy, 27-4-09 - Sell and 8-5-09 - Buy which is still open. In your chart with SMAs there are eight signals and the last one is already Sell on 1-6-09. But if you see the chart the ABAN price is still increasing. The other intermediate signals are not of much use.

I have used the following code for plotting:
Code:
[COLOR="Purple"]
E1 = EMA(C, 5);
E2 = EMA(C, 6);

Buy = Cross(E1, E2);
Sell = Cross(E2, E1);

MarkerShape = Buy * shapeUpArrow + Sell * shapeDownArrow;
MarkerColor = IIf(Buy, colorYellow, IIf(Sell, colorSkyblue, colorDefault));
MarkerDist = IIf(Buy, L, IIf(Sell, H, 0));

Plot(C, Name(), colorDefault, styleCandle);
Plot(E1, "EMA5", colorGreen, styleLine);
Plot(E2, "EMA6", colorRed, styleLine);
PlotShapes(MarkerShape, MarkerColor, 0, MarkerDist);[/COLOR]
Your comments please.

Regards

-Anant
 

Attachments

SavantGarde

Well-Known Member
Hi Anant,

Looking At The Last Bar On Your Chart Of ABAN Now What May Happen After Such WRB Is It Will Probably Consolidate Before Moving Up Again, That Is Why Yesterday ABAN Had Reached Its Earlier Given Target & If I Remember Rightly The Next Target Is 1503.00

Is It Possible To Generate BUY On Retracement, BUY On Trend Resumption, BUY On Trend Reversal After A Couple Of Red Bars Using 5 & 6 Crossover , While This Has Already Been Implemented On 20/50 Crossover, Where Target & S/L Is Mentioned With Approximately 1% Risk Resulting In Position Sizing.

BUYHOLD List Is Based On 5 & 6 Only Difference Being Doc's AFL Points Out The Exact Crossover Point, While Mine Triggers BUY On Confirmation Of The Next Few Bars.

Will EMA Work Consistently On All Stocks, Cause I Have Not Tried It, But Kalyan (kkseal) Had Mentioned It In One Of His Post & Now You Mention The Same.

Any Input & Opinion From You Will Be Extremely Important & Welcome In Trying To Iron Out The Glitches, So That Anybody Using It Could Atleast Find It Dependable In The Long Run.


Thanks A Ton

SavantGarde
 

asnavale

Well-Known Member
Hi izzner,

To get RT data into Ami you require a plugin. A plugin is a separate program which communicates with the main program when interfaced properly. One such program commercially available is Quotetracker. Some members in Traderji have written such plugins which take the RT quotes from servers like Yahoo!. Quote tracker takes quotes directly from NSE. You can find more details in the appropriate threads in Traderji.

Regards

-Anant
 

asnavale

Well-Known Member
Hi Anant,

Looking At The Last Bar On Your Chart Of ABAN Now What May Happen After Such WRB Is It Will Probably Consolidate Before Moving Up Again, That Is Why Yesterday ABAN Had Reached Its Earlier Given Target & If I Remember Rightly The Next Target Is 1503.00

Is It Possible To Generate BUY On Retracement, BUY On Trend Resumption, BUY On Trend Reversal After A Couple Of Red Bars Using 5 & 6 Crossover , While This Has Already Been Implemented On 20/50 Crossover, Where Target & S/L Is Mentioned With Approximately 1% Risk Resulting In Position Sizing.

BUYHOLD List Is Based On 5 & 6 Only Difference Being Doc's AFL Points Out The Exact Crossover Point, While Mine Triggers BUY On Confirmation Of The Next Few Bars.

Will EMA Work Consistently On All Stocks, Cause I Have Not Tried It, But Kalyan (kkseal) Had Mentioned It In One Of His Post & Now You Mention The Same.

Any Input & Opinion From You Will Be Extremely Important & Welcome In Trying To Iron Out The Glitches, So That Anybody Using It Could Atleast Find It Dependable In The Long Run.


Thanks A Ton

SavantGarde
Dear Savantji,

Today ABAN has given a higher green bar. So, it may further go up or start consolidating tomorrow onwards, which we have to wait and see.

As for the EMA system, I have read earlier in you reply that you don't use EMA. I am just experimenting with it. I am using both EMA 5/6 and EMA 20/50 systems and studying. I will post anything that is interesting and ask for your comments and suggestions.

Regards

-Anant
 
Last edited:

sashsaha0

Active Member
Just to make my doubts clear for a newbie like me when the candle stick graph intersects the top band (bollinger band ) consistently at regular intervals we can say that stock to be in an uptrend when the candle stick graph intersects both the top and bottom bands thenthe market is said to be choppy, am i wrong or right ?
just trying to learn from the experts here:)
 
Status
Not open for further replies.

Similar threads