Trading With CrossOver And BB

Status
Not open for further replies.

SavantGarde

Well-Known Member
SashSaha,

a) Please Do Not Apologise Every Time You Want To Ask Something.

b) Talking About BB Piercing, Is Like Putting The Cart Before The Horse, It Is Not A Very Important To Start With.

Will Try & Put A Separate Post For You This Weekend, I Am Glad You Are Using This Waiting Period To Get Some Basics Right.

By The Way Did You See Your Confidence Petroleum Being Flashed On CNBC Yesterday & Today In Connection With KP....:)


Happy & Safer Investing

SavantGarde

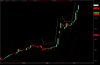
Just to make my doubts clear for a newbie like me when the candle stick graph intersects the top band (bollinger band ) consistently at regular intervals we can say that stock to be in an uptrend when the candle stick graph intersects both the top and bottom bands thenthe market is said to be choppy, am i wrong or right ?
just trying to learn from the experts here:)
 

uma_k

Well-Known Member
Dear Savantji,

Today ABAN has given a higher green bar. So, it may further go up or start consolidating tomorrow onwards, which we have to wait and see.

As for the EMA system, I have read earlier in you reply that you don't use EMA. I am just experimenting with it. I am using both EMA 5/6 and EMA 20/50 systems and studying. I will post anything that is interesting and ask for your comments and suggestions.

Regards

-Anant
Today ABAN has gone up further (8.4%). Cheers.

*** Uma ***
 

sashsaha0

Active Member
SashSaha,

a) Please Do Not Apologise Every Time You Want To Ask Something.

b) Talking About BB Piercing, Is Like Putting The Cart Before The Horse, It Is Not A Very Important To Start With.

Will Try & Put A Separate Post For You This Weekend, I Am Glad You Are Using This Waiting Period To Get Some Basics Right.

By The Way Did You See Your Confidence Petroleum Being Flashed On CNBC Yesterday & Today In Connection With KP....:)


Happy & Safer Investing

SavantGarde


Savant sir,
Whats the best to start with then ?sma?
 

asnavale

Well-Known Member
Today ABAN has gone up further (8.4%). Cheers.

*** Uma ***
Yes, its up again. as Savantji said will see how it behaves and hopefully touches his target of 1503.

If you see the chart, the Bollinger bands are widening further with the top band going up more steep. The MA 5 & 6 lines are also moving apart. These are indicating further rise.

One more thing I have observed here in the chart of ABAN attached below. From april 27 to May 19 the price pattern has a shape of letter 'J'. Again from May 19 onwards the same J pattern is forming. I have marked it with dotted lines. In the first pattern the lowest price was 392 and highest is 1000. A rise of 608. In the second pattern that is forming now, the lowest price is 801. If we add the previous rise of 608 it should touch 1409. Coming closer to Savantji's target.

This is just a wild idea. Not based on any technicals nor on any pattern analysis. Don't take it seriously.

-Anant
 

Attachments

SavantGarde

Well-Known Member
Hi Anant,

Yes, Your First 'J' Was The First Expansion Breakout, & Second 'J' Being The Second Expansion Breakout.

Only Time Will Tell....How Much More Legs It Has Left....So Far, It Is Not Exhibiting Any Weakness, Maybe Something To Do With Crude Bullishness.

Considering All Sorts Of Figures Are Being Projected By GS & Others, It May Have Lot More Steam Still Left....Not To Forget Crude Bullishness Is Predicated On Signs Of Global Improvement In Economy.


Happy & Safer Investing

SavantGarde

Yes, its up again. as Savantji said will see how it behaves and hopefully touches his target of 1503.

If you see the chart, the Bollinger bands are widening further with the top band going up more steep. The MA 5 & 6 lines are also moving apart. These are indicating further rise.

One more thing I have observed here in the chart of ABAN attached below. From april 27 to May 19 the price pattern has a shape of letter 'J'. Again from May 19 onwards the same J pattern is forming. I have marked it with dotted lines. In the first pattern the lowest price was 392 and highest is 1000. A rise of 608. In the second pattern that is forming now, the lowest price is 801. If we add the previous rise of 608 it should touch 1409. Coming closer to Savantji's target.

This is just a wild idea. Not based on any technicals nor on any pattern analysis. Don't take it seriously.

-Anant
 

balraj167

Active Member
Hi Savant Sir,

I am not been in this thread for long time, as far as my knowledge we can discuss about intra day trading with 15min Chart with 4&5 SMA cross and BB. Please find attached Chart of NIFTY 15min with 4&5 SMA & 9BB according to chart we can make entry on forth opening of bar that is 10.44 am reasons as follows:

1) Strong down trend
2) Engulfing Pattern: as the 3rd bar engulfs the 2nd bar that good sign of up move.
3) After completion of 3rd green bar we can see crossover of 4&5 SMA

Based on this we make entry on 4rth bar without any hesitation am I right?

Your valuable advice is always welcome Savant Sir,

Thanks
Balram
 
Last edited:

SavantGarde

Well-Known Member
Hi Scorpio,

It's Better To Track NiftyFuture, Along With It Track The Heavy Weights, Like RELIANCE, SBI, HDFC, HDFCBANK, NTPC, BHEL, BHARTIARTL, HUL, ITC, RELCAP, DLF, L&T, That Make The Nifty Move, Can't Remember All But Will List Them As It Comes To Mind.


Happy & Safer Trading

SavantGarde

Hi Savant,

For Nifty derivatives trading, do you recommend we track Nifty spot or futures chart? In my opinion the futures one would be a better indicator of things to come. Pls comment.
 
Status
Not open for further replies.

Similar threads