Okay, now I have to risk sounding like I am bad mouthing what others are doing.
Babypips has a lot of good points and can be helpful in a lot of ways, but they are so canned in their approach.
Trading is not so cut-n-dry where candle hits there then do this, when his happens then do that.
After all, looking at the daily chart with respect to the BB's, it was just waking up and beginning the journey.
You have to look at other TF's to see what they are indicating before you get too happy about a certain indication. This is why you also need to establish a winning reputation on your demo before going live.
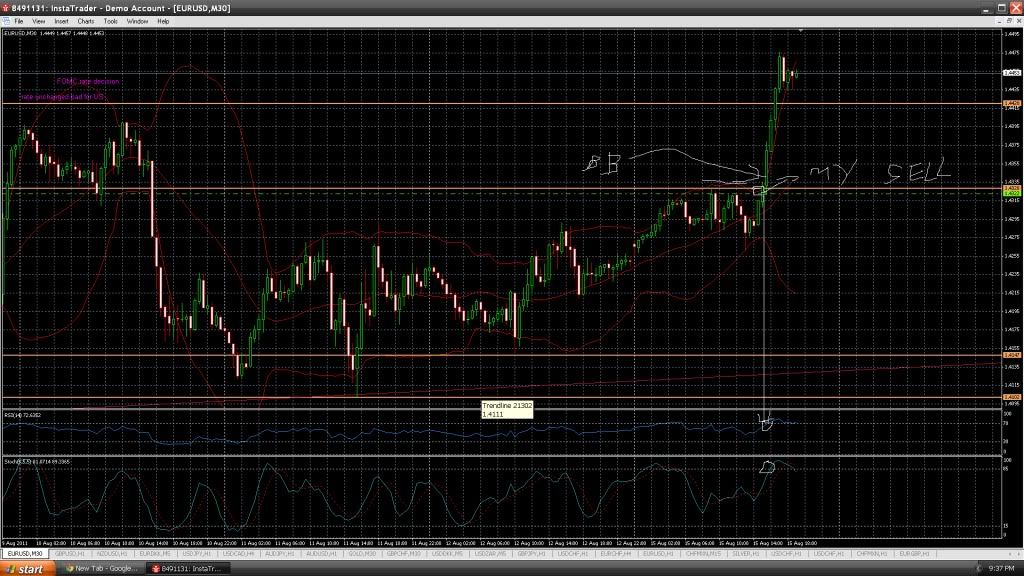
The hourly pointing straight up like a knife ready to dice a 70 line. When that happens, count on 3 more candles going the same direction.
BB's are the same way. Just because price hits the top, it does not mean sell. Just open any chart any TF and see how long candles cling to the top or bottom bands. I also mentioned SD statistics show there is a 5% chance of sigma 2 being broken. This is why I also talk a lot about plotting the 3 on your chart.
This is not designed as an assault on anyone. If it was the perfect world, such as hit the top and it bounces, hit the bottom and it bounces, then prices would never move. After all we got 1-minute charts. It takes a full 28 minutes to complete a cycle, If that cycle consisted of hitting the top band, then heading south, and hitting the bottom band (yo yo effect), then price would never move. Might as well trade off the 1-minute and make 5 pips per trade.
Let's review:
1. I said the indicators needs to be studied live and not take anyone's word for it. You have to know how the indicators work for yourself. You have to do live observations. This takes time.
2. It takes time to develop a methodology and you should be a proven winner on a demo account. This also takes additional time. There is nothing cut-n-dry about trading. This is why you need to be a student of the charts and indicators.
Let me add a further perspective to all this. You have had 1,314 hits on your thread. No one has disagreed with the principles of what I am talking about.
Take my word for it. You will not be a winning trader 6 months from now, but you can be filthy rich 10 years from now. It takes time.
Babypips has a lot of good points and can be helpful in a lot of ways, but they are so canned in their approach.
Trading is not so cut-n-dry where candle hits there then do this, when his happens then do that.
After all, looking at the daily chart with respect to the BB's, it was just waking up and beginning the journey.
You have to look at other TF's to see what they are indicating before you get too happy about a certain indication. This is why you also need to establish a winning reputation on your demo before going live.
The hourly pointing straight up like a knife ready to dice a 70 line. When that happens, count on 3 more candles going the same direction.
BB's are the same way. Just because price hits the top, it does not mean sell. Just open any chart any TF and see how long candles cling to the top or bottom bands. I also mentioned SD statistics show there is a 5% chance of sigma 2 being broken. This is why I also talk a lot about plotting the 3 on your chart.
This is not designed as an assault on anyone. If it was the perfect world, such as hit the top and it bounces, hit the bottom and it bounces, then prices would never move. After all we got 1-minute charts. It takes a full 28 minutes to complete a cycle, If that cycle consisted of hitting the top band, then heading south, and hitting the bottom band (yo yo effect), then price would never move. Might as well trade off the 1-minute and make 5 pips per trade.
Let's review:
1. I said the indicators needs to be studied live and not take anyone's word for it. You have to know how the indicators work for yourself. You have to do live observations. This takes time.
2. It takes time to develop a methodology and you should be a proven winner on a demo account. This also takes additional time. There is nothing cut-n-dry about trading. This is why you need to be a student of the charts and indicators.
Let me add a further perspective to all this. You have had 1,314 hits on your thread. No one has disagreed with the principles of what I am talking about.
Take my word for it. You will not be a winning trader 6 months from now, but you can be filthy rich 10 years from now. It takes time.
Sir on 1 hour chart, sir what i read in babypips that if a candles breaks above the upper bollinger band then it should be a sell and if it breaks the lower band it should be a buy ? then how does BB work?  sir on hourly chart rsi showed over 70 that means we should sell it i am all wrong
sir on hourly chart rsi showed over 70 that means we should sell it i am all wrong