Oscillators are lagging indicators. They cannot be backtested, all though the points you outlined shows me you have the right idea. The only way to accurately test an oscillator is to test it live. When you see it get close to the OB/OS region, then you should be getting ready to think in terms of a reversal. Watch for the crossover, and then the resulting action.
The 200 SMA is too much for a lot of people. It is just a more solid indication of S or R. With the 14, there are going to be many crossovers and oscillations. But then, that is why you always need a confluence.
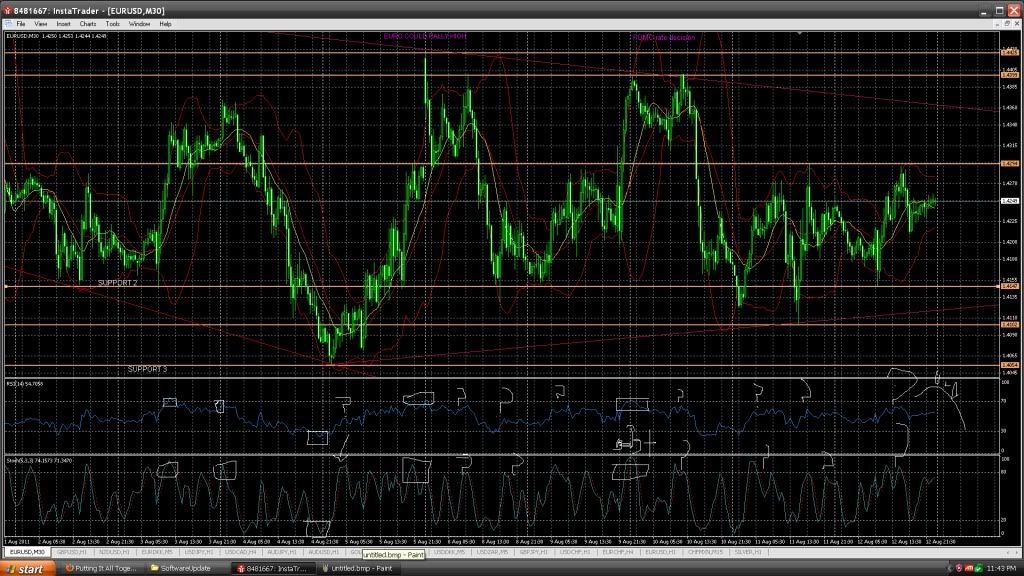
The 3rd line on the BB is the mean. There will always be a gravitational pull to the mean. If you plot a 1 (You have a 2 right now.) you will notice that at least 68% of all the data is contained between the 1's and the mean. The outward lines you have on the BB is a standard deviation of sigma 2 from the mean. That is showing an extreme reading from the mean.
I think you have your settings on 20,2. Try 28,2 and 28,3. All traders use their indicators differently. I like the setting of 28 on the BB, because the average cycle length for any market is circa 28, so the 28,s would be a truer measure of an extreme reading within that cycle. 5% of all data hits the 2 and 2% hits the 3, but that number will be a little higher because we are dealing with dynamic data. Most SD measurements are done with static data.
Oscillators, as well as all other indicators are not supposed to agree all the time. This is why you need a confluence. Also, in experimenting (This is only be a personal opinion.), it is okay to use all the oscillators you want, but eventually you may want to settle on just one, because they do, essentially, the same thing.
I would start with 5,5,5 on the stochastics, then experiment to find what is right for you. I would also set the OB/OS lines to 85 and 15, not the default at 80 and 20. There are more truer signals at 85 and 15.
RSI does not have to hit 70 to indicate sell. When it gets there, let it become an alert, then look at your other indicators to form a confluence.
THANK YOU
SIR ON 1 HOUR CHART I HAVE SET THE SMA TO 14 , ON 1 HOUR CHART WHAT DO YOU THINK?? BECAUSE 200 SMA WAS JUST TO MUCH FOR ME ON 1 HOUR CHART! IT REQUIRES LOTS OF SL, most of the time i have marked them as question mark! also i am using the bollinger bands which seems to give good indication when the candles cross the top bands its time to see when the candles crossed the down band its time to buy. sma is set to 14, but as you see in bollinger bands there should be 2 bands but why am i getting 3 bands 1 in the middle? sir when i see the RSI and Stoch together at some places they just do not agree together here is a chart! most of the time hence STOCH IS ABOVE 80 INDICATING A SELL BUT RSI DISAGREE'S STILL NOT TOUCHING 70 TO INDICATE SELL