i have funded 500$ , what amount should i aim for everyday?

Status
Not open for further replies.
#51
THIS IS THE CHART IN WHICH I WANT TO ASK YOU SIR THAT IF HAVE PLACED THE FIBO LEVEL CORRECTLY, - ? IF YOU LOOK AT IT CLOSELY SIR OR YOU CAN ZOOM IT :p YOU WILL SEE THAT I HAVE PLACED THE FIBO LEVEL FROM THE 11TH JULY WHEN IT STARTED TRENDING UP TILL 26TH JULY WHEN THE UPTREND COMPLETELY REVERSED AND STARTED GOING DOWN.. NOW IT IS CURRENTLY HOLDING AT 38.2 FIBO LEVEL, NOW FROM HERE HOW DO YOU PREDICT THAT WILL IT GO UP OR DOWN! ITS CONFUSING ! and also if you look at the whole chart i think the pair is moving in the form of DESCENDING TRIANGLE . the resistance according to me i see at R3=1.4365 R2= 1.4450 AND R3 =1.4530 (which is the 100 ext of fibo) I am sorry if i got wrong somewhere on in the charts please correct me! :(
 
Last edited:

4xpipcounter

Well-Known Member
#52
Fibonacci Iv

[IMG=http://img18.imageshack.us/img18/9989/46562148.gif][/IMG]

Uploaded with ImageShack.us

This post should answer your previous questions. (BTW, I can tell you are very new to all this by the type of questions you ask. They are very good questions, so keep asking.)

Let me start with the left side of the chart and work our way up because there are some things I want to point out.
On the left, it was a sharp uptrend that finally peaked. We had the sharp reversal and break of the TL which typifies a TL break. Afterward, and as mentioned before, the correction back to at least the point of the break ensued, and just to add effected, I added the straight line (SL) to show that.

Notice where the TL's cross. Not just because it is on this chart, but it is a fact that is a very strong, in this case, R. That is indicating it will reverse back onto the downtrend.

For the MT, expect the DOWN TL to hold as R, and for the trip south to continue for awhile. Your 1st alert that the trend has changed is when the candle breaks the TL. That is when you draw your new set of Fibos from the peak where the TL began to the dip.

The blue Fibo lines were drawn from the dip at 1.2874 to the peak at 1.4938, and the red Fibo lines were drawn from the the 2nd peak to the right to the recent dip. The blue Fibos give the bigger picture. Since the fall began, the lowest dip has been the 50% mark. With the steady downward momentum, it is feasible to see .618 hit over coming weeks.

The red Fibo lines give the shorter term picture. Notice how perfectly the .618 Fibo was hit. With the impulsive reversal, that suggests we are headed to lower lows.

The RSI is to be set at 14 with the lines set at 70-50-30. There's a reason for that. Notice how everytime when the 70 is broken or the 30 is broken that there is a strong continuation of the trend. In essence, that may seem to indicate OB/OS condition, but don't be fooled. Do not use this the same way you would MACD, stochastics, or Williams. The 50 line you want to watch for, particularly if price action is weak in that leg of the trend or the correction. If it approaches it while price action is weak, then a reversal is probably going to reverse. But, as always, use a confluence to confirm the entry. Never (Never) use just one indication.
This is my opinion, but I am not a big fan of using the RSI as divergence, because price action forces the reaction on its part, and then it would be too late for the trader to react.
 
Last edited:
#53
Re: Fibonacci Iv

[IMG=http://img18.imageshack.us/img18/9989/46562148.gif][/IMG]

Uploaded with ImageShack.us

This post should answer your previous questions. (BTW, I can tell you are very new to all this by the type of questions you ask. They are very good questions, so keep asking.)

Let me start with the left side of the chart and work our way up because there are some things I want to point out.
On the left, it was a sharp uptrend that finally peaked. We had the sharp reversal and break of the TL which typifies a TL break. Afterward, and as mentioned before, the correction back to at least the point of the break ensued, and just to add effected, I added the straight line (SL) to show that.

The blue Fibo lines were drawn from the dip at 1.2874 to the peak at 1.4938, and the red Fibo lines were drawn from the
FROM THE ?? sir the post didn't get completed?? btw i have been trading for the past 6 months i am very young and i almost give 14 hours on forex. yes i am asking these silly question :p because i am totally new to T.A i was almost married to F.A for the past 6 months . btw the chart which i have posted up it it right?? :confused:
 

4xpipcounter

Well-Known Member
#54


Uploaded with ImageShack.us

You are doing a good job and drawing the Fibos. I also noticed your TL which I think was drawn off the daily.

Sometimes, you cannot predict which way price action will go because price is at, what I call, a decision point-- price is trying to make a decision which way to go next. When it rides back up to the TL, one thing to watch for is the price action and the reading on the RSI. If it breaks the TL, just let it go, because as we know by now, the price will return to the point it broke the TL.

What I want you to notice on my chart, which is the 4-hour of the EUR/USD is the blue TL. It broke it convincingly, then eventually, made it back to the point it broke the line, then the pair came screaming back down to make a new low.

If you are going to use Fibos, then TL's are going to come in real handy for you. I use the ichimoku, and still the TL's are a tremendous help for me. You will notice in my Weekly Forecast that I do on my thread, I refer to them a lot.

BTW, strong background in math is not really necessary. The main thing is to understand how the Fibos work. I may talk of certain derivations, but don't let that bother you.


THIS IS THE CHART IN WHICH I WANT TO ASK YOU SIR THAT IF HAVE PLACED THE FIBO LEVEL CORRECTLY, - ? IF YOU LOOK AT IT CLOSELY SIR OR YOU CAN ZOOM IT :p YOU WILL SEE THAT I HAVE PLACED THE FIBO LEVEL FROM THE 11TH JULY WHEN IT STARTED TRENDING UP TILL 26TH JULY WHEN THE UPTREND COMPLETELY REVERSED AND STARTED GOING DOWN.. NOW IT IS CURRENTLY HOLDING AT 38.2 FIBO LEVEL, NOW FROM HERE HOW DO YOU PREDICT THAT WILL IT GO UP OR DOWN! ITS CONFUSING ! and also if you look at the whole chart i think the pair is moving in the form of DESCENDING TRIANGLE . the resistance according to me i see at R3=1.4365 R2= 1.4450 AND R3 =1.4530 (which is the 100 ext of fibo) I am sorry if i got wrong somewhere on in the charts please correct me! :(
 

4xpipcounter

Well-Known Member
#55
Re: Fibonacci Iv

I edited it, so it is ready.

Yes, as mentioned, you did a good job in drawing the Fibos and the TL.

Don't worry about silly questions. You got to learn.


FROM THE ?? sir the post didn't get completed?? btw i have been trading for the past 6 months i am very young and i almost give 14 hours on forex. yes i am asking these silly question :p because i am totally new to T.A i was almost married to F.A for the past 6 months . btw the chart which i have posted up it it right?? :confused:
 
#56
hi sir how are you thanks for help!, after the us market opened we could see that the eur/usd completely reversed and hit 1.4235(broker the fibo 50.0 level) currently trading on 1.4190. what are your views on this where do you think this pair is going? and are you a day trader or scalper? i would like to know ur point of view on this pair
 

4xpipcounter

Well-Known Member
#57
I scalp occasionally, but it is not my nature. I'm a daytrader / position trader, which is the style more suited to my nature.

1.4253 and 1.4333 aer key R's Regardless of what happens, 1.4385 is containment, as the pair still has its eye on 1.3906, and maybe 1.3833.


hi sir how are you thanks for help!, after the us market opened we could see that the eur/usd completely reversed and hit 1.4235(broker the fibo 50.0 level) currently trading on 1.4190. what are your views on this where do you think this pair is going? and are you a day trader or scalper? i would like to know ur point of view on this pair
 
#58
I scalp occasionally, but it is not my nature. I'm a daytrader / position trader, which is the style more suited to my nature.

1.4253 and 1.4333 aer key R's Regardless of what happens, 1.4385 is containment, as the pair still has its eye on 1.3906, and maybe 1.3833.
ok sir thank you , i am still in doubt about the fibo lines like if it is holding at 38.2 or 50.0 what does it indicate??for scalping sir WHICH TIMEFRAME CHART SHOULD I USE Like 1 hour or 4 hour chart because i want to draw the trendline. SIR PLEASE LOOK AT MY 1 HOUR CHART AND TELL ME IF THE TL IS OK OR NOT??
 

4xpipcounter

Well-Known Member
#60
Saiftauheed, let me suggest that in publishing your pic, rather in hitting "print screen, you can go to "file" > "save as picture". I noticed you have MT4, which is the platform I use. This way you won't publish all the personal information from your computer and your trading platform. Some people might disagree with me, but I don't think it is a good idea to publish personal information concerning your live account and what you have up on your personal computer.


Uploaded with ImageShack.us

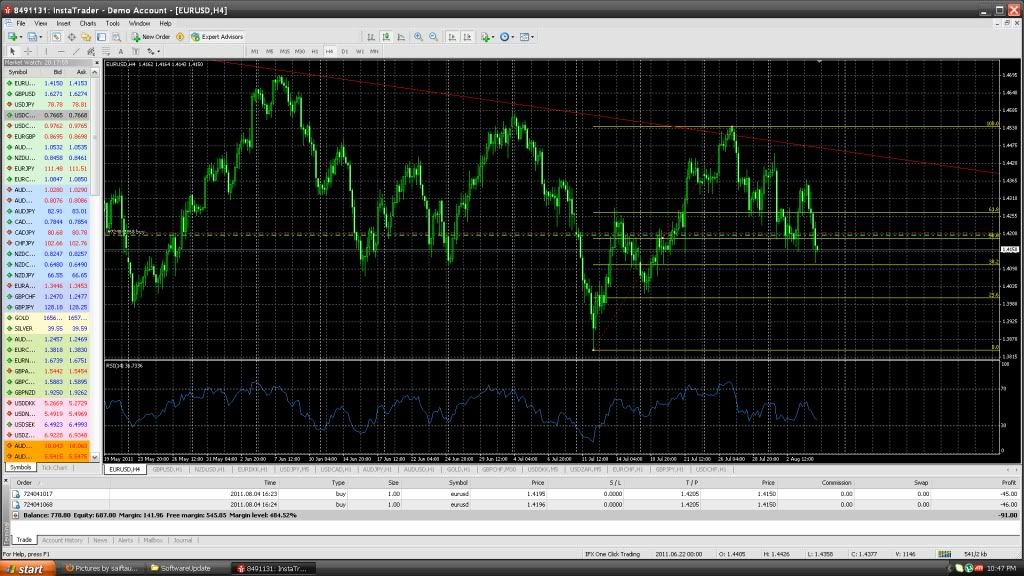
As an analogy, you are using a microscope to determine what is happening in the big picture. Your 0% line cannot be seen on this TF. If you pull back to the daily, then you can get a better idea of what is really happening.

If you draw the line from the dip to the peak, then your assumption is that you are in an uptrend, and you are waiting for the retracement in the uptrend to complete itself before it continues. Thus, you would look for the perfect correction at 61.8%, and then look for an entry.

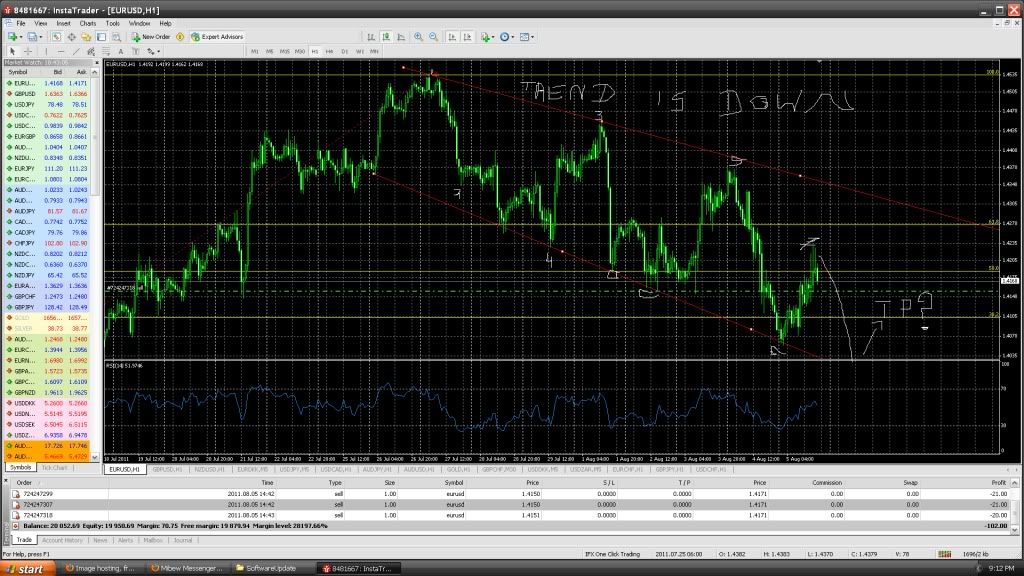
If my assumption is correct, then we are headed lower, so if I traded using Fibos and TL's, then I would be looking for an entry around the falling TL, as per my chart (BTW, I prefer your provider. Can you tell me how to post a pic in using them?), and the 50% Fibo.

If we are in an uptrend, then look for the falling TL to be broken, and then a correction back to it, then look to enter around the point it broke the TL, but after it corrects. In essence, if you look for a short around the falling TL, then you would have a low risk, small stop short entry, if you are wrong, then your short is taken out, and then you would have a low risk, small stop long.

If the TL is broken, then things will, at the least, get consolidative above it, and then your Fibos would need to be redrawn.

Also, be cognizant of the type of trade you want to enter, whether it be day, swing, or position. When you ask me how your TL's are drawn, I would answer they are drawn correctly, but I still did not really your question. This is because they are drawn on the hourly, which is showing at least an intraday downtrend, but the Fibos are drawn off of higher levels (It's evidenced by the fact the lower level is not on the map.), and by virtue of them being drawn from dip to peak, you are telling me we are in a short term uptrend. In essence the signals are confusing, which voids the effect of the Fibos.

Keep in mind that the above scenario could still play out, inasmuch that if the upper TL on your chart is broken, then we are in for an intraday trend switch, and then the question becomes, "Are we now in for a longer term UP, or a correction within the total longer term picture?"

Another thing that could be helpful for you if you plan on continuing to use Fibos is to draw a peak to dip and a dip to peak Fibo on the hourly, 4-hour, daily, weekly, and monthly, and then observe the price actions on the TF's. Your oscillator can also be of a benefit in predetermining price actions relative to the different TF's.
Watch for momentum, as it can be very helpful in determining where price action is going to head in the future. Let's say a market has a huge collapse at the end of a trend (TF does not matter.), then the trend reverses, but it takes 3 candles to make up for the ground of one candle from the collapse. Chances are the move is only corrective by nature. The thing to do there is scope down, draw your Fibos, and the TL, look for the confluence, then enter in the same direction of the collapse. Chances are a new low will be made. A look at the recent activity on the Swiss Franc will bear that out.
Also, if the market's trend has already begun, then it goes east (sideways), most likely the next strong move will be in the same direction upon arrival before the eastward motion. The thing to do in a case like that is draw your upper and lower channel lines, enter at the opposite end of the trend, but in the same direction of the trend, then you could even add to the position once the opposite channel is broken.

Having said all that, it looks like you are doing a good job in drawing your TL's and your Fibos. It also seems to me you have a grasp of your oscillator. You could have all that down pat, but unless you understand the introspections of the trends, and the trends within the trends, and even the respective corrections, then everything you learned about Fibos and TL's could be for naught.

Here's one more point just for good measure. "The proper perspective of the markets and how they work does not sell e-books, but it does put money in your pocket consistently" That is just one of 4xpipcounter's quotes. Believe me, it is true.

You're doing a good job, so just keep up with your studies.

May I share what appears to be a factitious comment? It has been 9 days since Vicky made her appearance. I wonder if she thinks your thread is redundant now. It sure is getting a lot of traffic.

ok sir thank you , i am still in doubt about the fibo lines like if it is holding at 38.2 or 50.0 what does it indicate??for scalping sir WHICH TIMEFRAME CHART SHOULD I USE Like 1 hour or 4 hour chart because i want to draw the trendline. SIR PLEASE LOOK AT MY 1 HOUR CHART AND TELL ME IF THE TL IS OK OR NOT??
 
Last edited:
Status
Not open for further replies.

Similar threads