


NIFTY FIFTY
- Thread starter AMITBE
- Start date
- Status
- Not open for further replies.
AMITBE said:
To the up theres congestion coming ahead.
The line is 2668-2674-2680-2686-2690.
Then the line is 2694-2698-2702-2706-2710-2714.
Will call more once this is taken out.
Supports are 2659-2654-2648-2642-2636-2630-2624-2618-2612-2606-2599.
The line is 2668-2674-2680-2686-2690.
Then the line is 2694-2698-2702-2706-2710-2714.
Will call more once this is taken out.
Supports are 2659-2654-2648-2642-2636-2630-2624-2618-2612-2606-2599.
Even so, the magic lies above 2742 and this has to be held.
Under no circumstances should 2710 be given up.
Above 2742 the potential is 2747-2752-2757-2762 and if this is held, the extension is 2767-2772-2776-2783-2788.
Supports are same as mentioned above.
Agilent said:
Ganesh,
Dont forget that if we are in a bear market .. as against an intermediate 'reaction' or correction in the 3 yr old bull market... then the bottom you talk about will be merely the bottom of the first (down) leg of the bear market .
Subsequent legs will reach lower bottoms ... Until the primary trend reverses. And typically , bear markets will have at least a couple of such 'legs'
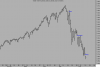
See chart attached for what happened during the 2000-2002 bear market, when each of three bottoms was followed by an intermediate rally, only to be finally 'floored' by the lowest bottom towards the end of 2001
AGILENT
Dont forget that if we are in a bear market .. as against an intermediate 'reaction' or correction in the 3 yr old bull market... then the bottom you talk about will be merely the bottom of the first (down) leg of the bear market .
Subsequent legs will reach lower bottoms ... Until the primary trend reverses. And typically , bear markets will have at least a couple of such 'legs'
See chart attached for what happened during the 2000-2002 bear market, when each of three bottoms was followed by an intermediate rally, only to be finally 'floored' by the lowest bottom towards the end of 2001
AGILENT
I hope you're already aware of the liquidity in japanese market yesterday...late night, the expert corrected that it was for better of economic betterment, hence i believe that the market may see +ve again..
anyway, the world markets had enough, now is the time to see a pull back..
out of the world, bse and nse had most of the beating...they've been thrashed too much, and now nothing but recovery reamains..i do not mean that we're entering a stable market..we'll see volat. for some more time, but i firmly believe that as we were overbought till sometime back, we are oversold now....
Also i'm sure you must be well aware that Mr Jhunjhunwala had meeting (secret) with his investors...and he told that there is nothing to panic...
will give some more updates why I believe the market is oversold later...
Still I would say, money is yours, you are a better judge...play safe..
ganeshhity
Also i'm sure you must be well aware that Mr Jhunjhunwala had meeting (secret) with his investors...and he told that there is nothing to panic...
Rgds
Rahul
rahulg77 said:
Yes you are right, one of my friends did send me the power point presentation regarding it too. I have deleted it by mistake. will call for it again and will attach it if u are interested. I am not sure if its from the same meeting u are talking about.
Rgds
Rahul
Rgds
Rahul
and do not worry friend, we may be seeing an uptrend now...I've already picked some scrips..and yes, this time with strict stop losses my friend..I've learnt a lot from this correction...or ooooops a crash..
ganeshhity
tnk said:
Hi Amitbe,
Recently I have got in to the following stoccks....
Reliance Petro
Reliance Communications
Guj Ambuja
Balrampur Chiney
ITC
My major one is with Relpet and Relcom.
What would be your outlook for these stocks.......at the moment they are in the negative.....
Thanks.
Recently I have got in to the following stoccks....
Reliance Petro
Reliance Communications
Guj Ambuja
Balrampur Chiney
ITC
My major one is with Relpet and Relcom.
What would be your outlook for these stocks.......at the moment they are in the negative.....
Thanks.
sugars would do good.....(Balrampur Chini)
ITC is again a strong giant......
So it you've taken above 3 in current market, you're sure of making profits in long term......all above are fundamentaly strong....
Regarding reliance petro, I doubt this for a long time now..I'm sure the worldwide oil scenario and recent prices will not let this stock into profit for long....
Rel Comm.....this has been a hot stock for long.....I now doubt whether it would be able to perform same as it did in the recent bull market...
moreover, my friend, I would love to know at what prices you bought the above stocks..I assume you bought them in past couple of days...
Seniors correct me if I'm wrong in explanation....Sorry amitda for responding in your thread....
hey hey hey....I guess this thread is for nifty....
ganeshhity
ganeshhity said:
Thanks agilent for your near to accurate views ( I use the word near to accurate because there seems to be no "accurate view" in current market)...I was out for sometime, out of news, out of market, out of world rather...I just returned to the world of stocks, have been going thoroughly what happened in last 10 days...just to my surprise ( i presume, but strong thought now) that the markets are oversold now....better divide your money into 3 parts, invest one part now and wait.....
I hope you're already aware of the liquidity in japanese market yesterday...late night, the expert corrected that it was for better of economic betterment, hence i believe that the market may see +ve again..
anyway, the world markets had enough, now is the time to see a pull back..
I hope you're already aware of the liquidity in japanese market yesterday...late night, the expert corrected that it was for better of economic betterment, hence i believe that the market may see +ve again..
anyway, the world markets had enough, now is the time to see a pull back..
Yes I did get to know abt the Liquidity crisis in Japan.
In fact , the writing was on the wall ... see attached report of April ... funny no Indian analyst/expert seemed to be aware or took that seriously (I know its easy to say in hindsight .. but then aren't analysts supposed to look out for such warning signals ?)
Monday afternoon CNBC carried excerpts of an interview Maria Bartiromo had with George Soros, when he attributed the current meltdown in Emerging markets mainly to the pullout of $26 billion (if I remember right) from the Japanese banking system. (And pl don't ask me who is Maria ... )
So that's that.
AGILENT
These are a couple of quotes from Traderjis postings on this thread on June 8:
These values have been derived from the monthly charts, and for the Nifty the date would be May 31 05. The line chart that Traderji had attached is here: http://www.traderji.com/attachments/equities/1656-nifty-fifty-nse50.gif?d=1149751961
Now, yesterday with the low at 2595, the Nifty has intraday all but tested its 50% retracement taken from that point.
A pure Fibonacci number I had pointed out to is 2584, and for all that is worth, even this has been tested, but by a very fine margin.
Whether this is rummaging through the destruction to come up with positive features is another matter.
On the other hand, the 200 DMA for the Nifty lies way above at 2912.
The TA maxim that says in these circumstances, the least the Nifty needs to do to bring in some semblance of a bullish disposition is to trade above this level.
To be realistic however, at todays levels this seems too far a horizon even to test:
As things go higher there will be desperate selling and vicious shorting.
Theres a long way to go, and again as I mentioned a few days ago, take it one day at a time.
2675-2680 is the point to cross and hold before progress can be made with 2643-2647 area coming up as resistance. A gap up, scary as it may sound would likely take care of this.
What happens beyond that is to be seen later.
For supports, lets for now go with yesterdays lows as they are important levels.
Traderji said:
If the BSE SENSEX were to retrace 50% of its entire move from the June 2004 Lows to the recent high that level would be at 8580.00! A 38.2% retracement level of the same move would be at 9486.00
It would be best for investors to wait out the current correction and then enter long (on evidence of an uptrend) into the strongest stocks (stocks that have corrected the least) in the outperforming sectors.
It would be best for investors to wait out the current correction and then enter long (on evidence of an uptrend) into the strongest stocks (stocks that have corrected the least) in the outperforming sectors.
Traderji said:
Yes, the 38.2% and 50% retracement levels for the Nifty are approx. 2850 and 2600.
Now, yesterday with the low at 2595, the Nifty has intraday all but tested its 50% retracement taken from that point.
A pure Fibonacci number I had pointed out to is 2584, and for all that is worth, even this has been tested, but by a very fine margin.
Whether this is rummaging through the destruction to come up with positive features is another matter.
On the other hand, the 200 DMA for the Nifty lies way above at 2912.
The TA maxim that says in these circumstances, the least the Nifty needs to do to bring in some semblance of a bullish disposition is to trade above this level.
To be realistic however, at todays levels this seems too far a horizon even to test:
As things go higher there will be desperate selling and vicious shorting.
Theres a long way to go, and again as I mentioned a few days ago, take it one day at a time.
2675-2680 is the point to cross and hold before progress can be made with 2643-2647 area coming up as resistance. A gap up, scary as it may sound would likely take care of this.
What happens beyond that is to be seen later.
For supports, lets for now go with yesterdays lows as they are important levels.
- Status
- Not open for further replies.
| Thread starter | Similar threads | Forum | Replies | Date |
|---|---|---|---|---|
| M | Nifty option strategy chart in Dhan Optiontrader | Brokers & Trading Platforms | 3 | |
| S | EOD data for Nifty 50 with volume | Introductions | 0 | |
| L | Nifty fifty and stock futures | Swing Trading | 13 | |
| M | Veluri Strategy intraday nifty fifty | Software | 96 | |
| T | Nifty Fifty Only + GOLD SILVER | Data Feeds | 0 |
Similar threads
-
Nifty option strategy chart in Dhan Optiontrader
- Started by MetatraderUser
- Replies: 3
-
-
-
-