Trading With CrossOver And BB

Status
Not open for further replies.

rkkarnani

Well-Known Member
#61
RK sir,

really happy to see your post. before I go any further, let me clarify certain things.

1. The basic idea of trading intra day with the help of crossover was germinated in savant ji's " Nifty Pivot points Thread" in mid-feb.

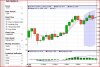
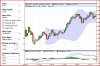
2. After some discussions, with Ajax,Kamalesh and others it was decided by, savant ji, that 15 min. time frame and 4&5 sma crossover is best suited for intraday trading..

3. The strategy above mentioned is a basic one at its simplest form. there could be many many additions, like scaling in, scaling out, anticipatory trading
based on the angle of the averages' , stops, SARs, etc.,

4. The basic idea is of savant ji's. He is in the process of finalising all the rules. here I am just trying to generate discussions.


yes sir. it's a typo. what you have mentioned is correct.


normally I am putting market order at 10.31


close of the bar sir.

here I think the angle of the SMA plays a role. if it indicates a continuation, we can take the trade. on the other hand, the sma is flattening we may have to wait for a clear trend.

once again thank you sir for your inputs.
Thanks Prsadam for your detailed reply. Shall go through the MAIN thread of Savant and come back here for more clarifications if any.
All the best.
-R K Karnani
 
#62
hello docvijay4usir,

SMA 4 and SMA 5 means 4 min & 5 min SIMPLE MOVING AVERAGES or 4 day & 5 day MOVING AVERAGES.....................sir i m asking this question because i m using yahoo finance EOD charts for study purpose...and when i select daily chart and sma 5 than it shows 5 min SMA..............THANKS IN ADVANCE SIR...........:)
 

docvijay4u

Well-Known Member
#63
Hi,

Simple Moving Averages Depends On Time Frame We Choose. If TimeFrame Of Chart Is In Minutes Then SMA Would Be Calculated Based On Minute Data For The Values We Choose For SMA. Making It Simple In This Case TF Is 15 Min And SMA Is 4 & 5 So Calculation Will Be Made On Recent 4 & 5, 15 Minute Bar Data. Same Hold True For Hourly, Daily, Weekly, Monthly, Quartely, Yearly TimeFrame.

At Basic Level:

- In Case Of EOD Charts SMA 4 And 5 Means: 4 Day SMA And 5 Day SMA Which Is Useful For Swing Or Positional Trading(For EOD Chart With Daily Interval).
- In Case Of Intraday Charts SMA 4 And 5 Means: 4 Min SMA And 5 Min SMA Which Is Useful For Day Trading(For IntraDay Chart With 1 Min Interval).

For More Insight You Can Check The Source Of Information-
http://www.investopedia.com/university/movingaverage/movingaverages3.asp

And Yes Please No Sir, You Might Have Seen I'm Also Learning Here.

Thanks.:)

hello docvijay4usir,

SMA 4 and SMA 5 means 4 min & 5 min SIMPLE MOVING AVERAGES or 4 day & 5 day MOVING AVERAGES.....................sir i m asking this question because i m using yahoo finance EOD charts for study purpose...and when i select daily chart and sma 5 than it shows 5 min SMA..............THANKS IN ADVANCE SIR...........:)
 
Last edited:

vicky_ag

Well-Known Member
#64
Doc Sir,
Simple moving averages are calculated based on the TF bars, we are asked to input while drawing the SMA.
So, on 15 min TF, if we say 4 SMA applied at close, it would be a SMA based on close of 4 previous 15 min bars. If, a particular chart lacks the number of bars there would be no calculations. This is what precisely happens in case you choose a single day chart, the first entry would appear only at 11 am.(after 4 15min bars values have come in) It is not a 4 min calculation, if it was the case, the whole system would just create whiplashes.

The, at close, portion is not specified on jcharts which are extensively used in the Indian markets. But, just for add info, we can have SMA based not only on bar close prices but also on open, high, low, median prices etc.

I have attached two charts on 5 mins and 15mins TF. you can see the slightest of difference in the SMA's on both TF. Also, the SMA tend to appear after enough bars are collected.
Hi,

Simple Moving Averages Depends On Time Frame We Choose. If TimeFrame Of Chart Is In Minutes Then SMA Would Be Calculated Based On Minute Data For The Values We Choose For SMA. Making It Simple In This Case TF Is 15 Min And SMA Is 4 & 5 So Calculation Will Be Made On Recent 4 & 5 Min. Data. Same Hold True For Hourly, Daily, Weekly, Monthly, Quartely, Yearly TimeFrame.

- In Case Of EOD Charts SMA 4 And 5 Means: 4 Day SMA And 5 Day SMA Which Is Useful For Swing Or Positional Trading.
- In Case Of Intraday Charts SMA 4 And 5 Means: 4 Min SMA And 5 Min SMA Which Is Useful For Day Trading.

For More Insight You Can Check The Source Of Information-
http://www.investopedia.com/university/movingaverage/movingaverages3.asp

And Yes Please No Sir, You Might Have Seen I'm Learning Here.

Thanks.:)
 

Attachments

docvijay4u

Well-Known Member
#65
Wow!!! Thanks Editing Post As Per You Explanation. Thanks For Pointing Out Mis-Interpretation And For Avoiding Spread Of Wrong Knowledge.

Thanks.:)

Doc Sir,
Simple moving averages are calculated based on the TF bars, we are asked to input while drawing the SMA.
So, on 15 min TF, if we say 4 SMA applied at close, it would be a SMA based on close of 4 previous 15 min bars. If, a particular chart lacks the number of bars there would be no calculations. This is what precisely happens in case you choose a single day chart, the first entry would appear only at 11 am.(after 4 15min bars values have come in) It is not a 4 min calculation, if it was the case, the whole system would just create whiplashes.

The, at close, portion is not specified on jcharts which are extensively used in the Indian markets. But, just for add info, we can have SMA based not only on bar close prices but also on open, high, low, median prices etc.

I have attached two charts on 5 mins and 15mins TF. you can see the slightest of difference in the SMA's on both TF. Also, the SMA tend to appear after enough bars are collected.
 
Last edited:
#68
Thanks vijaybhai and vickybhai for answers (explainations).......so the charts explained by prasadamji earlier with 4 sma and 5 sma (jcharts) on 15 min TF means last 4 & 5 bars (15 MIN bars )close average ?
on yahoo chart (intraday charts)when u select on intraday chart 5 SMA AND 10 SMA ,they display 5 min SMA and 10 min SMA...and as per my knowledge yahoo intraday charts are on 5 min TF ...so i interpret it like , it is showing 5 min candles...and when we select 5 and 10 sma or ema it displays last 5 mins and 10 mins moving average of nifty price or any selected script not last 5 and 10 bars (of 5 min TF)close average .... .....i m very confused still...................plz i need further help............icharts or trading tiger by sharekhan or yahoo is SMA concept same na...? sorry for bothering u guys more.......traderji.com rocks...........thanks in advance..............
 
#69
thanks vijaybhai and vikybhai for answers.........but i m still confused.....my confusion is as in earlier posts charts explained by prasadamji (jcharts) he said that 4 & 5 sma on 15 TF.....is that means last 4 & 5 bars (15 min interval bars) moving average........?
reason for confusion is i m following yahoo finance EOD intraday charts for study purpose...and that are default 5 min TF charts....and on that charts if i select 5 and 10 sma or ema it displays 5 & 10 mins moving average of nifty or any selected stock.....so my confusion is here it is showing last 5 mins moving average and in charts (jcharts by icharts dot in) explained by you it shows last 4 & 5 bars (of 15 min interval )close average.........is it diff in yahoo and icharts.....? plz i need further explaination vickybhai,vijaybhai and the one and only savant sir...............thanks in advance............
 

SavantGarde

Well-Known Member
#70
Hi Mayur,

Let Me Try & Clarify This, Let Us Say You Are Using 10 Min TF, Therefore You Will Have A Bar Or Candlestick Appearing At Every 10 Min & Each Candle Or Bar Indicates The Following, Open, High, Low & Close & And Also Indicates If The Price For That Particular Bar Opened High & Closed Lower Or Vice Versa Depending On Colour Of The Candlestick.

Now Coming To SMA Will Always Will Be Calculated As An Average Of The Bars / Candlestick Depending On What SMA You Choose, Whether 4, 5, 6... Etc.

So Number Of Bars/Candlestick Is Depending On What TF & SMA Is Always Average Of The Previous Bars/Candlestick.

These Rules Can't Change Whichever Service Provider's Chart You Choose To See.

If You Still Have Any Doubt Let Us Know.


Happy & Safer Trading

SavantGarde
 
Status
Not open for further replies.